

Spotted-Wing Drosophila Impacts, 2013
go.ncsu.edu/readext?625305
en Español / em Português
El inglés es el idioma de control de esta página. En la medida en que haya algún conflicto entre la traducción al inglés y la traducción, el inglés prevalece.
Al hacer clic en el enlace de traducción se activa un servicio de traducción gratuito para convertir la página al español. Al igual que con cualquier traducción por Internet, la conversión no es sensible al contexto y puede que no traduzca el texto en su significado original. NC State Extension no garantiza la exactitud del texto traducido. Por favor, tenga en cuenta que algunas aplicaciones y/o servicios pueden no funcionar como se espera cuando se traducen.
Português
Inglês é o idioma de controle desta página. Na medida que haja algum conflito entre o texto original em Inglês e a tradução, o Inglês prevalece.
Ao clicar no link de tradução, um serviço gratuito de tradução será ativado para converter a página para o Português. Como em qualquer tradução pela internet, a conversão não é sensivel ao contexto e pode não ocorrer a tradução para o significado orginal. O serviço de Extensão da Carolina do Norte (NC State Extension) não garante a exatidão do texto traduzido. Por favor, observe que algumas funções ou serviços podem não funcionar como esperado após a tradução.
English
English is the controlling language of this page. To the extent there is any conflict between the English text and the translation, English controls.
Clicking on the translation link activates a free translation service to convert the page to Spanish. As with any Internet translation, the conversion is not context-sensitive and may not translate the text to its original meaning. NC State Extension does not guarantee the accuracy of the translated text. Please note that some applications and/or services may not function as expected when translated.
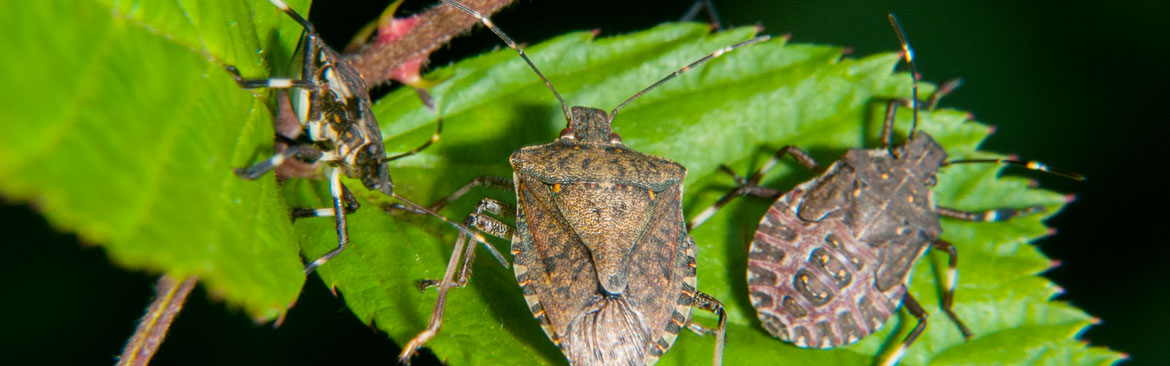
Collapse ▲One of the missions of the eFly Spotted Wing Drosophila (SWD) Working Group is to assess the impact of SWD in affected host crops, particularly in the eastern United States. Affected crops have included blueberries, blackberries, cherries, grapes, raspberries, and strawberries. The first of these impact statements was developed in 2012, and drew upon expert observers in several eastern states to determine the extent of crop losses and input increases associated with SWD. The eFly SWD Working Group includes entomologists, extension professionals, fruit growers, and fruit marketers.
During the most recent eFly SWD Working Group meeting, held January 8 & 9 2014 in Savannah, GA, participants[i] determined that greater stakeholder response would improve impact assessments and therefore developed and subsequently distributed a mixed-mode survey instrument via either an online questionnaire or in person paper surveys distributed at grower meetings held throughout the eastern United States from January 9 through February 22, 2014. In total, 87 respondents completed the survey online, and 162 respondents completed paper surveys. Meetings where paper surveys were distributed were held in AL, GA, MO, NC, NJ, and PA. The online questionnaire was made available at the eFly SWD Working Group website (swd.ncsu.ces.edu); emailed as a link to grower email lists, grower organizations, and cooperative extension agents; and was available from January 20 through February 28, 2014.
Respondent geographic diversity
Survey respondents were from at least 28 different states (Figure 1); five respondents declined to provide their location or were from outside the United States. Demographic information in addition to state was collected from respondents to the online survey, and of those (n=87), 39% were conventional fruit growers, 8.5% were organic fruit growers, 9.4% were extension agents or specialists, 0.85% were fruit marketers, 1.7% were crop consultants, 3.4% were homeowners, and 3.4% were engaged in other activities or did not provide demographic information. Demographic information beyond state was not collected on paper surveys as all respondents were growers.
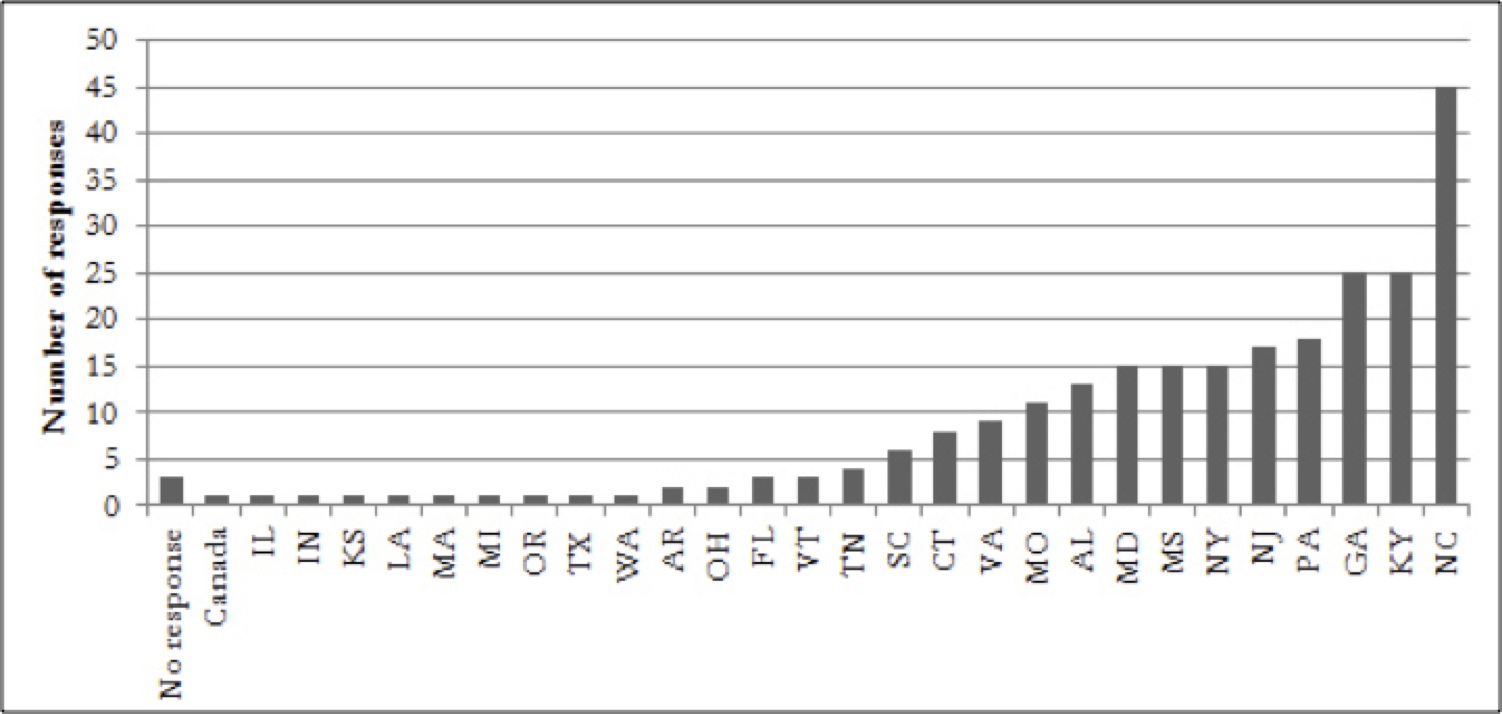
Figure 1. Number of respondents by state, combined online and paper surveys. Four respondents declined to provide state information.
Because information about SWD infestation at the farm level is potentially sensitive, states or crops within a state with fewer than two responses are not presented separately in the tables below, but these data were included in pooled summaries over all states or across a crop.
Crop information for respondents
Over half of the respondents grew multiple SWD host crops (Figure 2), and the greatest number of responses, representing the largest proportion of US acreage were from blueberry growers (Table 1). A relatively large number of blackberry and raspberry growers were also represented.
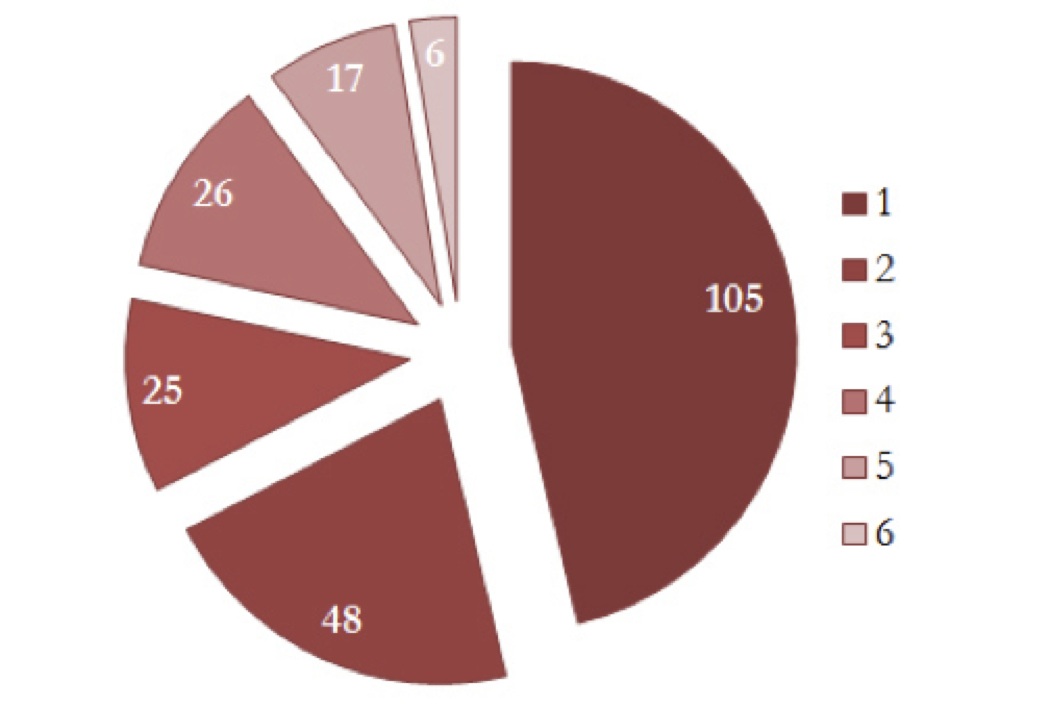
Figure 2. Number of spotted wing drosophila host crops (1 to 6) grown by respondents, excluding unspecified “other” responses.
Table 1. Spotted wing drosophila host crops grown by respondents.
| Crop | Number of respondents growing crop | Total acres represented | Percentage of total US acres* |
| Blueberries (highbush) | 155 | 9,338 | 9.7% |
| Blackberries | 102 | 816 | 5.4% |
| Raspberries | 80 | 275 | 1.2% |
| Strawberries | 72 | 542 | <1% |
| Cherries | 32 | 120 | <1% |
| Grapes | 62 | 28 | <1% |
*Acreage used to calculate percent of total US area via 2012 Census of Agriculture.
Crop level impacts
The average, minimum and maximum reported percentage loss across all responses for each crop was calculated (Tables 2-7). In addition, average loss by crop was calculated for each state with more than two total responses and compared to the value of each crop within a state. Crop values for each reporting state were obtained either from the USDA NASS Noncitrus Fruit and Nut Preliminary Summary, January 2013 when available, or estimated based on reported acreage in 2012 Census of Agriculture and reported crop value and yield per acre from the USDA NASS Noncitrus Fruit and Nut Preliminary Summary, January 2013. Due to federal sequestration, final statistics for the 2013 crop year were not available, so these estimates were the most current available. The total observed losses for each crop were then summed. Potential crop losses were also calculated based on the total value of a crop within all reporting states and the average percentage loss observed across all states. In the case of blueberries, blackberries, and cherries, potential losses were higher than observed losses. However in some cases, notably raspberries, strawberries, and grapes, crop loss in reporting states was higher than averaged potential loss, due to particularly high loss percentages in states with high crop value.
When totaled across all crops, the observed loss due to SWD during 2013 in states represented in our survey was $27,558,238.
We further compared the effect of farm size on reported crop loss across all reporting growers (Tables 8-13). In general, small farms experienced higher crop loss than larger farmers across, and small farms were also more likely to experience 100% crop loss due to SWD than were larger farms. At least one blueberry, blackberry, or raspberry grower reported 100% crop loss, but no strawberry, cherry, or grape growers reported total crop loss. This suggests that SWD damage may be more severe in blueberries, blackberries, and raspberries than in the other reported crops.
Management practice impacts
Reported crop losses did not occur in a management vacuum, so we also asked respondents about input increases associated with SWD, specifically insecticide usage and labor. A majority (59% of all respondents) said that they had increased their insecticide usage after SWD had been detected in their area or on their farm and 44% of respondents said that they had an increase in labor associated with SWD management (Table 14). Growers who experienced an increase in insecticide usage estimated that this cost 88% more per acre, and growers with an increase in reported labor costs estimated this increase to be 12%. Therefore, our crop loss figures should be viewed through the lens, in most circumstances, of significantly increased insecticide use and often an associated increase in labor costs.
Because the questions related to management practice increases were asked to respondents once on the survey, the responses are summarized for two different groups of growers for each crop (Table 14). First, reported management increases for all growers of a given crop are presented, and second, management increases for those growers who reported only growing a single crop are presented. As the majority of respondents grew more than one crop (Figure 2), the second summary statistic is more accurate when considering a given crop but applies to a narrower subset of respondents. In order to estimate the total potential costs associated with insecticide usage across all crops, we used reported cost increases for growers of single crops and scaled these values by the total acres represented in our survey (Table 1). Where single crop values were not reported due to low responses, the value for all growers of a given crop was used (raspberries, strawberries, cherries). The estimated cost of increased pesticide usage for respondents to our survey was $1,339,418. The greatest average increase in pesticide costs associated with SWD was observed by growers producing only blackberries ($314/acre), and 12 of these 13 growers experienced an increase in pesticide use in response to SWD.
Table 2. Estimated blueberry crop value lost due to spotted wing drosophila in responding states. Crop value data via USDA NASS Noncitrus Fruit and Nut Preliminary Summary, January 2013 unless otherwise noted.
| Crop | Number of responses | Average percentage crop loss | Minimum observed loss | Maximum observed loss |
| Blueberries (all) | 139 | 4.7% | 0% | 100% |
| State | Number of responses | Average percentage crop loss | 2012 estimated crop value | Estimated 2013 crop value loss |
| AL | 8 | 3% | $1,484,000 | $445,20 |
| CT | 7 | 13% | $4,336,675* | $563,768 |
| FL | 2 | 0% | $62,073,000 | $0 |
| GA | 17 | 4% | $94,130,000 | $3,765,200 |
| KY | 10 | 3% | $3,593,819* | $107,815 |
| MD | 10 | 5% | $1,375,288* | $68,764 |
| MO | 8 | 4% | $1,947,488* | $77,900 |
| MS | 15 | 3% | $15,550,000 | $466,500 |
| NC | 19 | 2% | $71,000,000 | $1,420,000 |
| NJ | 15 | 5% | $80,805,000 | $4,040,250 |
| NY | 9 | 2% | $3,893,000 | $77,860 |
| PA | 12 | 3% | $10,369,874* | $311,096 |
| SC | 5 | 2% | $5,691,886* | $113,838 |
| TN | 3 | 39% | $3,573,742* | $1,393,759 |
| VA | 4 | 13% | $4,246,373* | $552,028 |
| Estimated observed loss across reporting states | $13,003,298 | |||
| Potential total loss across reporting states | $17,111,297 | |||
*Values determined based on reported acreage in 2012 Census of Agriculture and crop value ($1.69/lb fresh and processed combined) and yield per acre (5940 lb) estimates from USDA NASS Noncitrus Fruit and Nut Preliminary Summary, January 2013.
Table 3. Estimated blackberry crop value lost due to spotted wing drosophila in responding states.
| Crop | Number of responses | Average percentage crop loss | Minimum observed loss | Maximum observed loss |
| Blackberries (all) | 88 | 12% | 0% | 100% |
| State | Number of responses | Average percentage crop loss | 2012 estimated crop value | Estimated 2013 crop value loss |
| AL | 6 | 0% | $2,623,700* | $0 |
| CT | 4 | 40% | $365,325* | $146,130 |
| FL | 2 | 18% | $5,081,344* | $914,642 |
| GA | 8 | 14% | $9,465,249* | $1,325,134 |
| KY | 11 | 14% | $4,068,397* | $569,576 |
| MD | 10 | 20% | $747,257* | $149,451 |
| MO | 6 | 0% | $4,300,879* | $0 |
| NC | 18 | 10% | $6,725,309* | $672,530 |
| NJ | 2 | 0% | $1,461,301* | $0 |
| PA | 8 | 23% | $2,441,038* | $561,439 |
| SC | 3 | 7% | $2,723,335* | $190,633 |
| TN | 3 | 6% | $5,131,161* | $307,870 |
| VA | 9 | 11% | $4,466,933* | $491,363 |
| Estimated observed loss across reporting states | $5,328,768 | |||
| Potential total loss across reporting states | $5,416,115 | |||
*Values determined based on reported acreage in 2012 Census of Agriculture and crop value ($2.11/lb fresh) and yield per acre (7870 lb) estimates from USDA NASS Noncitrus Fruit and Nut Preliminary Summary, January 2013. Eastern yield estimates in research trials range from 18,000 to 20,000 lb/acre, so values are likely conservative.
Table 4. Estimated raspberry crop value lost due to spotted wing drosophila in responding states.
| Crop | Number of responses | Average percentage crop loss | Minimum observed loss | Maximum observed loss |
| Raspberries | 67 | 16.3% | 0% | 100% |
| State | Number of responses | Average percentage crop loss | 2013 estimated crop value | Estimated 2013 crop value loss |
| CT | 7 | 31% | $1,110,690* | $344,314 |
| KY | 6 | 4% | $555,345* | $22,214 |
| MD | 10 | 3% | $774,900* | $23,247 |
| MO | 3 | 7% | $400,365* | $28,026 |
| NC | 7 | 19% | $891,135* | $169,316 |
| NJ | 2 | 17% | $1,097,775* | $186,622 |
| NY | 9 | 31% | $8,846,775* | $2,742,500 |
| PA | 12 | 15% | $3,616,200* | $542,430 |
| VA | 7 | 14% | $1,743,525* | $244,094 |
| VT | 2 | 20% | $1,420,650* | $284,130 |
| Estimated observed loss across reporting states | $4,586,893 | |||
| Potential total loss across reporting states | $3,334,550 | |||
*Values determined based on reported acreage in 2012 Census of Agriculture and crop value ($2.05/lb fresh) and yield per acre (6300 lb) estimates from USDA NASS Noncitrus Fruit and Nut Preliminary Summary, January 2013. Eastern yield estimates in research trials range from 7,000 to 10,000 lb/acre, so values are likely conservative.
Table 5. Estimated strawberry crop value lost due to spotted wing drosophila in responding states.
| Crop | Number of responses | Average percentage crop loss | Minimum observed loss | Maximum observed loss |
| Strawberry | 60 | 3.9% | 0% | 50% |
| State | Number of responses | Average percentage crop loss | 2013 estimated crop value | Estimated 2013 crop value loss |
| AL | 3 | 0% | $2,109,584* | $0 |
| GA | 5 | 8% | $1,869,252* | $149,540 |
| KY | 5 | 0% | $2,763,823* | $0 |
| MD | 11 | 3% | $2,937,396* | $88,122 |
| NC | 8 | 4% | $29,435,000 | $1,177,400 |
| NY | 9 | 4% | $6,880,000 | $275,200 |
| PA | 9 | 4% | $8,480,000 | $339,200 |
| TN | 3 | 0% | $3,818,614* | $0 |
| VA | 6 | 15% | $3,872,022* | $580,803 |
| Estimated observed loss across reporting states | $2,610,265 | |||
| Potential total loss across reporting states | $2,424,462 | |||
*Values determined based on reported acreage in 2012 Census of Agriculture and crop value ($1.54/lb fresh, excluding CA values) and yield per acre (8,670 lb, excluding CA yields) estimates from USDA NASS Noncitrus Fruit and Nut Preliminary Summary, January 2013.
Table 6. Estimated cherry crop value lost due to spotted wing drosophila in responding states.
| Crop | Number of responses | Average percentage crop loss | Minimum observed loss | Maximum observed loss |
| Cherry | 24 | 3.1% | 0% | 20% |
| State | Number of responses | Average percentage crop loss | 2013 estimated crop value | Estimated 2013 crop value loss |
| KY | 3 | 0% | $37,386* | $0 |
| MD | 12 | 4% | $171,618* | $6,865 |
| PA | 3 | 0% | $1,220,706* | $0 |
| VA | 3 | 10% | $91,345* | $9,135 |
| Estimated observed loss across reporting states | $15,999 | |||
| Potential total loss across reporting states | $47,153 | |||
*Values determined based on reported acreage in 2012 Census of Agriculture and crop value ($0.594/lb) and yield per acre (2,330 lb) estimates from USDA NASS Noncitrus Fruit and Nut Preliminary Summary, January 2013 for tart cherry.
Table 7. Estimated grape crop value lost due to spotted wing drosophila in responding states.
| Crop | Number of responses | Average percentage crop loss | Minimum observed loss | Maximum observed loss |
| Grape | 49 | 2% | 0% | 20% |
| State | Number of responses | Average percentage crop loss | 2013 estimated crop value | Estimated 2013 crop value loss |
| AL | 4 | 0% | $2,649,219* | $0 |
| GA | 6 | 0% | $5,624,000 | $0 |
| KY | 12 | 2% | $3,195,398* | $63,908 |
| MD | 7 | 4% | $3,476,144* | $139,046 |
| NC | 16 | 2% | $4,469,000 | $89,380 |
| PA | 4 | 5% | $20,555,000 | $1,027,750 |
| TN | 3 | 15% | $4,619,545* | $692,932 |
| Estimated observed loss across reporting states | $2,013,015 | |||
| Potential total loss across reporting states | $891,766 | |||
*Values determined based on reported acreage in 2012 Census of Agriculture and crop value ($669/ton) and yield per acre (7.63 ton) estimates from USDA NASS Noncitrus Fruit and Nut Preliminary Summary, January 2013.
Table 8. Reported percentage crop loss in blueberries by farm size.
| Very large farms (Greater than 100 acres) | ||||
| Number of responses | Average loss | Minimum observed loss | Maximum observed loss | |
| 22 | 5.3% | 0% | 30% | |
| Large farms (100-50 acres) | ||||
| Number of responses | Average loss | Minimum observed loss | Maximum observed loss | |
| 11 | 2.4% | 0% | 10% | |
| Medium farms (10-50 acres) | ||||
| Number of responses | Average loss | Minimum observed loss | Maximum observed loss | |
| 25 | 3.4% | 0% | 20% | |
| Small farms (Less than 10 acres | ||||
| Number of responses | Average loss | Minimum observed loss | Maximum observed loss | |
| 81 | 5.2% | 0% | 100% | |
Table 9. Reported percentage crop loss in blackberries by farm size.
| Large farms (100-50 acres) | |||
| Number of responses | Average loss | Minimum observed loss | Maximum observed loss |
| 6 | 18.5% | 1% | 50% |
| Medium farms (10-50 acres) | |||
| Number of responses | Average loss | Minimum observed loss | Maximum observed loss |
| 11 | 11.4% | 0% | 35% |
| Small farms (Less than 10 acres) | |||
| Number of responses | Average loss | Minimum observed loss | Maximum observed loss |
| 71 | 11.7% | 0% | 100% |
Table 10. Reported percentage crop loss in raspberries by farm size.
| Medium farms (10-50 acres) | ||||
| Number of responses | Average loss | Minimum observed loss | Maximum observed loss | |
| 6 | 5.8% | 0% | 25% | |
| Small farms (Less than 10 acres) | ||||
| Number of responses | Average loss | Minimum observed loss | Maximum observed loss | |
| 61 | 17.4% | 0% | 100% | |
Table 11. Reported percentage crop loss in strawberries by farm size.
| Medium farms (10-50 acres) | |||
| Number of responses | Average loss | Minimum observed loss | Maximum observed loss |
| 13 | 4.3% | 0% | 20% |
| Small farms (Less than 10 acres | |||
| Number of responses | Average loss | Minimum observed loss | Maximum observed loss |
| 46 | 3.9% | 0% | 50% |
Table 12. Reported percentage crop loss in cherries by farm size.
| Small farms (Less than 10 acres) | |||
| Number of responses | Average loss | Minimum observed loss | Maximum observed loss |
| 22 | 3.4% | 0% | 20% |
Table 13. Reported percentage crop loss in grapes by farm size.
| Large farms (100-50 acres) | |||
| Number of responses | Average loss | Minimum observed loss | Maximum observed loss |
| 2 | 0% | 0% | 0% |
| Medium farms (10-50 acres) | |||
| Number of responses | Average loss | Minimum observed loss | Maximum observed loss |
| 7 | 2.6% | 0% | 10% |
| Small farms (Less than 10 acres) | |||
| Number of responses | Average loss | Minimum observed loss | Maximum observed loss |
| 39 | 2.1% | 0% | 20% |
Table 14. Input increases associated with spotted wing drosophila summarized by crop. Note that growers were asked about input increases across their entire farm, not for individual crops. Categories with fewer than two responses are indicated by -.
| Crop (n respondents) | Number of respondents increasing pesticide use | Reported percentage increase and reported additional cost per acre | Average reported cost increase/acre for additional pesticide use | Number of respondents with increasing labor costs | Average percentage of labor increase |
| All respondents (248) | 146 | 88% | $165/acre | 110 | 12% |
| Respondents only growing blueberries (63) | 37 | 108% | $95/acre | 25 | 18% |
| All respondents growing blueberries | 99 | 84% | $153/acre | 72 | 25% |
| Respondents only growing blackberries (13) | 12 | 139% | $341/acre | 7 | 15% |
| All respondents growing blackberries (88) | 75 | 87% | $192/acre | 56 | 27% |
| Respondents only growing raspberries | – | – | – | – | – |
| All respondents growing raspberries (67) | 59 | 87% | $202/acre | 49 | 29% |
| Respondents only growing strawberries (6) | 1 | 10% | – | 2 | 10% |
| All respondents growing strawberries (60) | 50 | 70% | $185/acre | 43 | 28% |
| Respondents only growing grapes (20) | 7 | 39% | $109/acre | 6 | 78% |
| All respondents growing grapes (49) | 36 | 59% | $178/acre | 24 | 31% |
| Respondents only growing cherries | – | – | – | – | – |
| All respondents growing cherries (24) | 24 | 71% | $184/acre | 17 | 75% |
[i] eFly SWD Working Group participants, 2014: Hannah Burrack, Jesse Hardin, and Katherine Swoboda, NC State University Department of Entomology; Gina Fernandez, NC State University Department of Horticultural Sciences; Ric Bessin, University of Kentucky Department of Entomology; Elina Coneva, Auburn University College of Agriculture; Steve Dalton, Fruit of the Spirit Farms, Hendersonville, NC; Renee Holland, University of Georgia Cooperative Extension; Les Dozier, President of Arkansas Blueberry Growers Association; Powell Smith and Susan James, Clemson University Cooperative Extension, Ash Sial and Dan Horton, University of Georgia Department of Entomology; Donn Johnson, University of Arkansas Department of Entomology; Gerard Krewer, organic blueberry grower and consultant; Joseph LaForest, Southern Integrated Pest Management Center; Jackie Lee, Oklahoma State University Department of Entomology and Plant Pathology; Oscar Liburd, University of Florida Department of Entomology; Joel Lineberger, Kildeer Farms, Kings Mountain, NC; Doug Pfeiffer, Virginia Tech University Department of Entomology; Cesar Rodriguez-Saona Rutgers University Department of Entomology; Daniel Shires, North Carolina State University Cooperative Extension; Dave Trinka, Michigan Blueberry Growers, Inc; Debby Weschler, Executive Secretary, North American Blackberry and Raspberry Association; Albert Wildes, President, Georgia Blueberry Association.